-
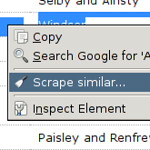
Google Chrome Scraper Extension
The Scraper extension is one of the easiest ways to get data out of a webpage. Simply mark the section you want to extracts, right-click and choose "scrape similar...". It allows for more complex scrapings through xpath settings. -
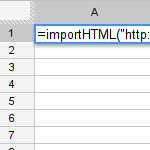
Google Spreadsheets
The Google Spreadsheet formula =importHTML() allows importing of simple html tables and lists to google spreadsheets. No more re-typing from web-pages or annoying cutting and pasting. -

Scraperwiki
When the data you want to scrape of the web becomes bigger and more complicated: Scraperwiki to the rescue. It is a wiki-style platform allowing you to write code, store data and run scrapers regulary. Also supports PDF scraping. -
gImageReader + Tesseract
Unlucky you: All you have is a scanned document or PDF? Don't despair: OCR can help. gImageReader provides a great frontend for Tesseract OCR and allows you to extract the text from PDFs.
-
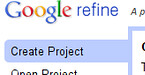
Open Refine
Dirty Data? Who you gonna call? Refine! Started by freebase, bought by google - turned into an open source project. Refine has a unstable history. Nevertheless it is our favorite tool to clean up messy datasets. (Check our Recipe to learn how) -
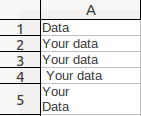
Spreadsheets
Can't install refine? No problem: You can clean your data using spreadsheets. We do have a whole course dedicated to this. Don't hesitate! -
Nomenklatura
Developed by our own Friedrich Lindenberg, Nomenklatura allows you to reconcile categories using a web-based API. Thus once reconciled your scripts can automatically clean your data for you.
-
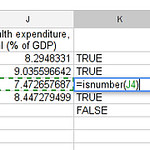
Spreadsheets
Spreadsheets are a good tool for basic analysis. Once you get a feeling for how to use formulas, you'll be doing simple analysis as you go. -

R
A powerful language to work with data. It might seem intimidating to learn programming simply to draw analysis from but R is so powerful you want to check it out once you get into serious data issues. It has evolved into one of the large Data Analysis languages out there. -

Gephi
If you need to step up from tables to analyzing networks and graphs: Gephi is there for you. A powerful tool to visualise and analyse networks (think social networks, links between politicians and companies and so on)
-

Tile Mill
Tile Mill allows you to create a map from your data without being a GIS professional. Straight forward to use - try it out! -

Fusion Tables
Fusion Tables is Googles take on visualizing data. It allows for easy geocoding (to get your data on a map) and much more. If you want visualizations online: give it a try. -
Gephi
Mentioned also in Analysis - Gephi allows you to visualize graphs and networks using different layouts. All without having to know too much about the theory behind it. Beautiful networks in a few clicks! -

Many Eyes
IBM's many eyes is a large toolkit for creating visualizations from Data. Get inspired by the various ways you can display your information (and pick the best for your purpose) -

D3
D3 is a javascript library to create data driven documents (hence the 3 d's). While it has a steep learning curve - the results are stunningly beautiful. There is plenty of example code to base your visualization on!
-
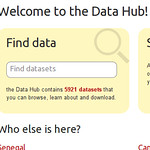
The Datahub
Need to share your data with everyone? Please proceed to the datahub. Based on the CKAN dataportal software this is the community driven data portal you want to share your data on. -
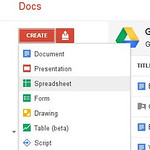
Google Docs
One of the easier ways to share data and documents - Simply use the share settings in your Google Doc and tell everyone where to find your stuff! -

Github
You have more than data to share? Maybe some scripts as well? Github is there to coordinate your social coding efforts and allows others to suggest changes and improvements. Have an octocat!